Visualization
The [viz] extra adds a small, beautiful matplotlib plotting module. Like every
optional adapter it imports matplotlib lazily — importing wayfault stays
numpy-only.
All functions live in
wayfault.adapters.outbound.viz, return a
matplotlib.figure.Figure, and never call show() — you decide whether to
display or save.
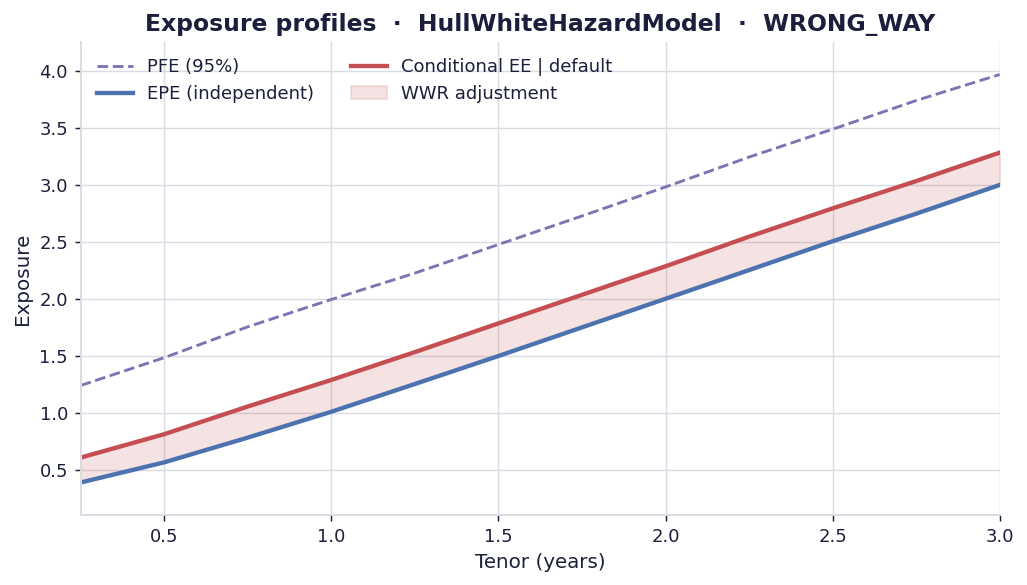
Exposure profiles
EPE, conditional EE given default, and PFE across the tenor grid. The shaded gap is the wrong-/right-way adjustment.
from wayfault import estimate_wwr
from wayfault.adapters.outbound import viz
from wayfault.adapters.outbound.exposure_inmemory import InMemoryExposureSource
from wayfault.adapters.outbound.credit_flat import FlatHazardCreditCurveSource
from wayfault.adapters.outbound.dependence_hullwhite import HullWhiteHazardModel
import numpy as np

tenors = [i / 4 for i in range(1, 13)]
cube = np.asarray(tenors) + np.random.default_rng(0).normal(scale=0.6, size=(20_000, 12))
exposure = InMemoryExposureSource(cube, tenors)
credit = FlatHazardCreditCurveSource(hazard=0.02, recovery=0.4)

result = estimate_wwr(exposure, credit, HullWhiteHazardModel(b=0.8))

fig = viz.plot_exposure_profiles(result)
viz.save(fig, "exposure_profiles.png")
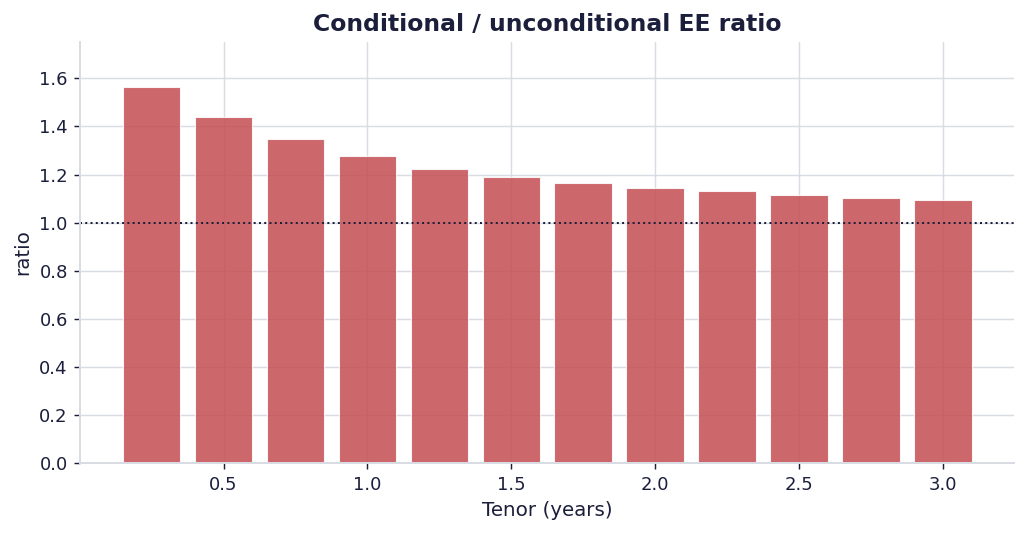
EE ratio
Per-tenor conditional/unconditional EE ratio — red bars above 1 (wrong-way), green below 1 (right-way).
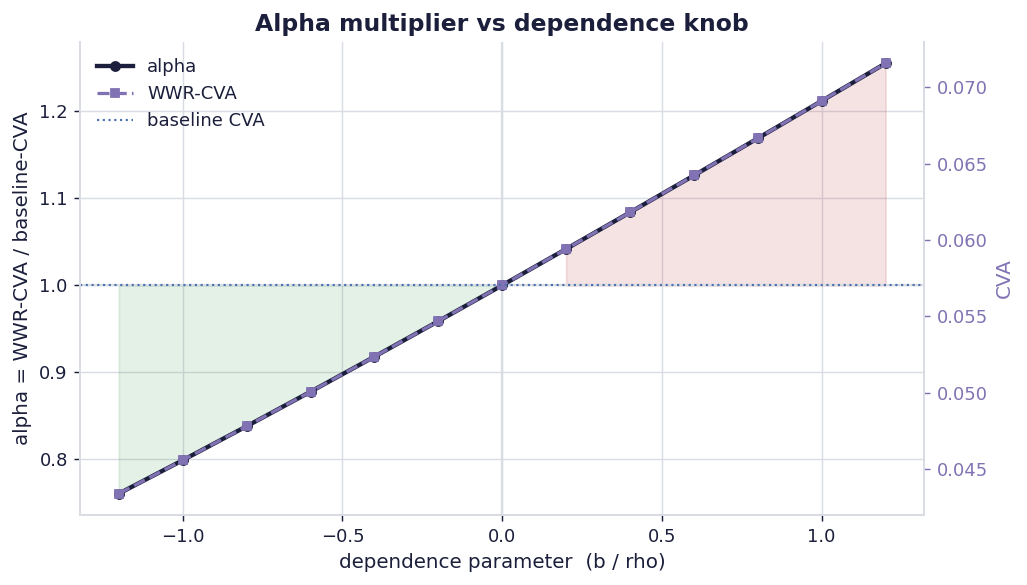
Alpha sweep
Sweep the dependence knob and plot the alpha multiplier (and CVA) against it. The shading flips colour at the independence point.
bs = np.linspace(-1.2, 1.2, 13)
sweep = [estimate_wwr(exposure, credit, HullWhiteHazardModel(b=b)) for b in bs]
alphas = [r.alpha for r in sweep]
wwr_cvas = [r.wwr_cva for r in sweep]

fig = viz.plot_alpha_sweep(bs, alphas, wwr_cvas, baseline_cva=sweep[0].baseline_cva)
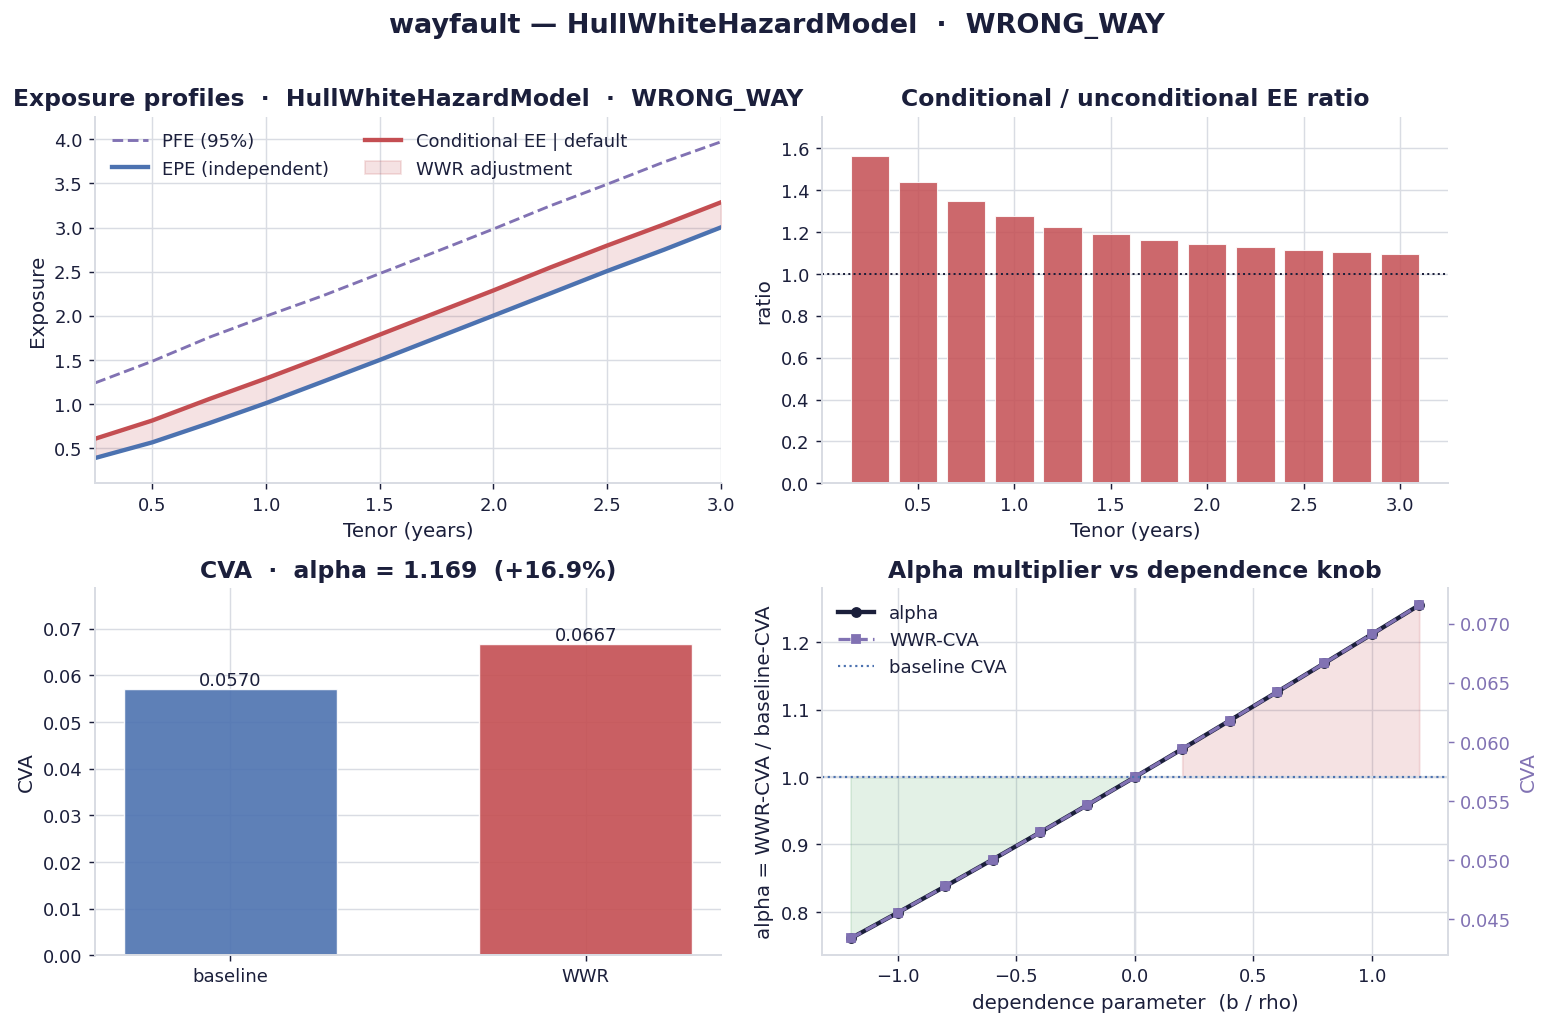
Dashboard
Everything at a glance: profiles, EE ratio, CVA comparison, and the alpha curve.
fig = viz.plot_dashboard(result, bs=bs, alphas=alphas, wwr_cvas=wwr_cvas)
viz.save(fig, "dashboard.png")
Reproducing the gallery
All four images are generated by
examples/gallery.py:
API
wayfault.adapters.outbound.viz 
Diagnostic plotting adapter ([viz] extra, lazy import).
Beautiful, self-contained matplotlib visualisations of WWR results. Every
function imports :mod:matplotlib lazily and raises
:class:~wayfault.domain.errors.MissingDependencyError if the [viz] extra
is not installed, so importing :mod:wayfault stays numpy-only.
All functions return a matplotlib.figure.Figure and never call show;
the caller decides whether to display or save.
plot_exposure_profiles 
Plot EPE, conditional-EE, and PFE across the tenor grid.
The gap between the conditional EE and the EPE is shaded to highlight the wrong-/right-way adjustment.
Parameters:
| Name | Type | Description | Default |
|---|---|---|---|
result
|
WWRResult
|
The :class: |
required |
ax
|
Axes | None
|
Optional existing axes to draw on; a new figure is created otherwise. |
None
|
Source code in src/wayfault/adapters/outbound/viz.py
plot_ee_ratio 
Bar chart of the per-tenor conditional/unconditional EE ratio.
Source code in src/wayfault/adapters/outbound/viz.py
plot_alpha_sweep 
plot_alpha_sweep(bs: Sequence[float], alphas: Sequence[float], wwr_cvas: Sequence[float] | None = None, baseline_cva: float | None = None, ax: Axes | None = None) -> Figure
Plot the alpha multiplier (and optionally CVA) against the WWR knob.
Parameters:
| Name | Type | Description | Default |
|---|---|---|---|
bs
|
Sequence[float]
|
The swept dependence parameters (Hull-White |
required |
alphas
|
Sequence[float]
|
The corresponding alpha multipliers. |
required |
wwr_cvas
|
Sequence[float] | None
|
Optional WWR-CVA values, drawn on a secondary axis. |
None
|
baseline_cva
|
float | None
|
Optional baseline CVA, drawn as a reference line on the CVA axis. |
None
|
ax
|
Axes | None
|
Optional existing axes. |
None
|
Source code in src/wayfault/adapters/outbound/viz.py
plot_dashboard 
plot_dashboard(result: WWRResult, bs: Sequence[float] | None = None, alphas: Sequence[float] | None = None, wwr_cvas: Sequence[float] | None = None) -> Figure
A 2x2 summary dashboard for a single WWR result.
Combines the exposure profiles, the EE ratio, a CVA comparison bar, and — when a sweep is provided — the alpha curve.
Source code in src/wayfault/adapters/outbound/viz.py
save 
Save a figure to path (PNG/SVG/PDF inferred from the extension).