Visualisation
esnfed.viz (optional, pip install "esnfed[viz]") provides four plots, each available in three backends: plotly (the default, interactive), matplotlib, and seaborn. Every function returns the native figure object.
from esnfed import EchoStateNetwork, topologies, viz
W = topologies.small_world_reservoir(120, k=6, p=0.1, rng=0)
esn = EchoStateNetwork(1, 1, W, spectral_radius=0.9).fit(u_tr, y_tr)
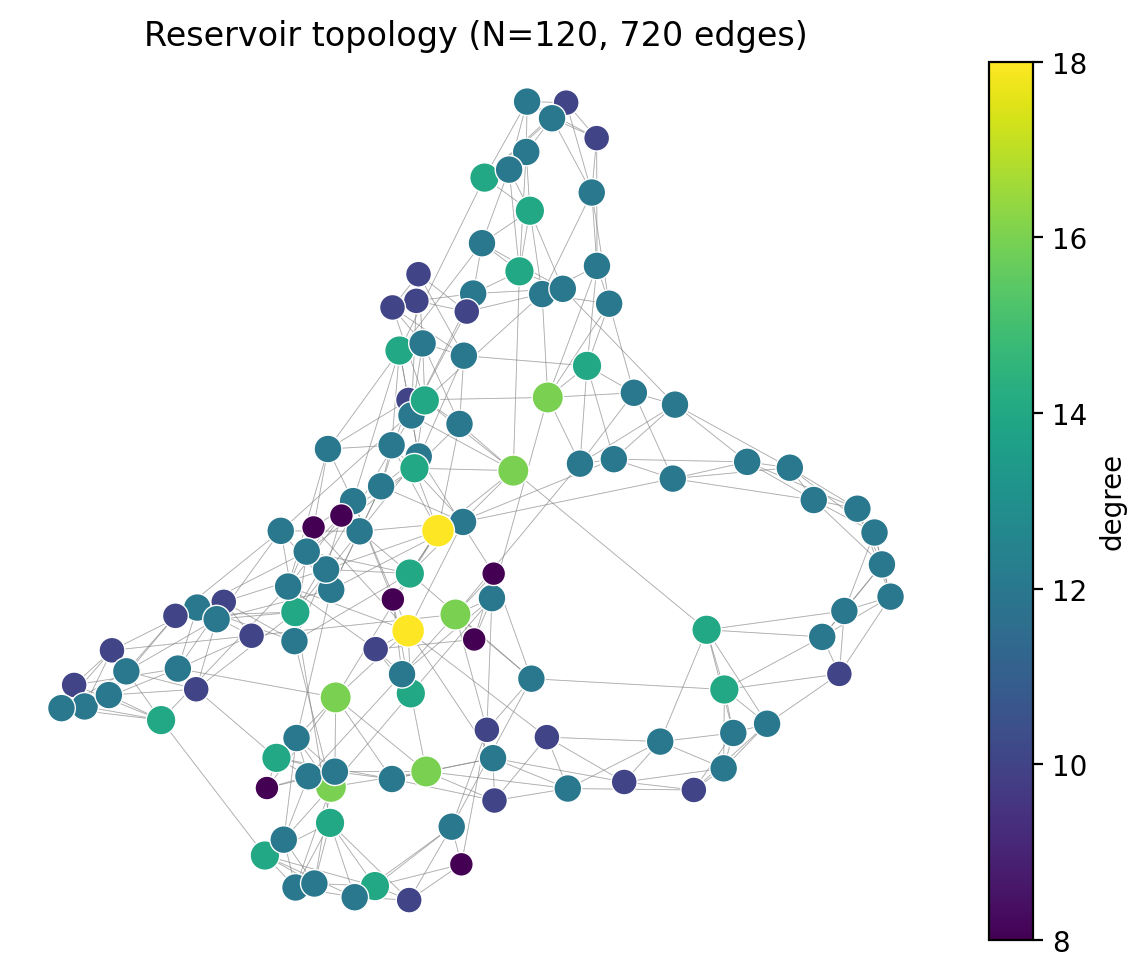
viz.plot_reservoir(esn).show() # connectivity graph (degree-coloured)
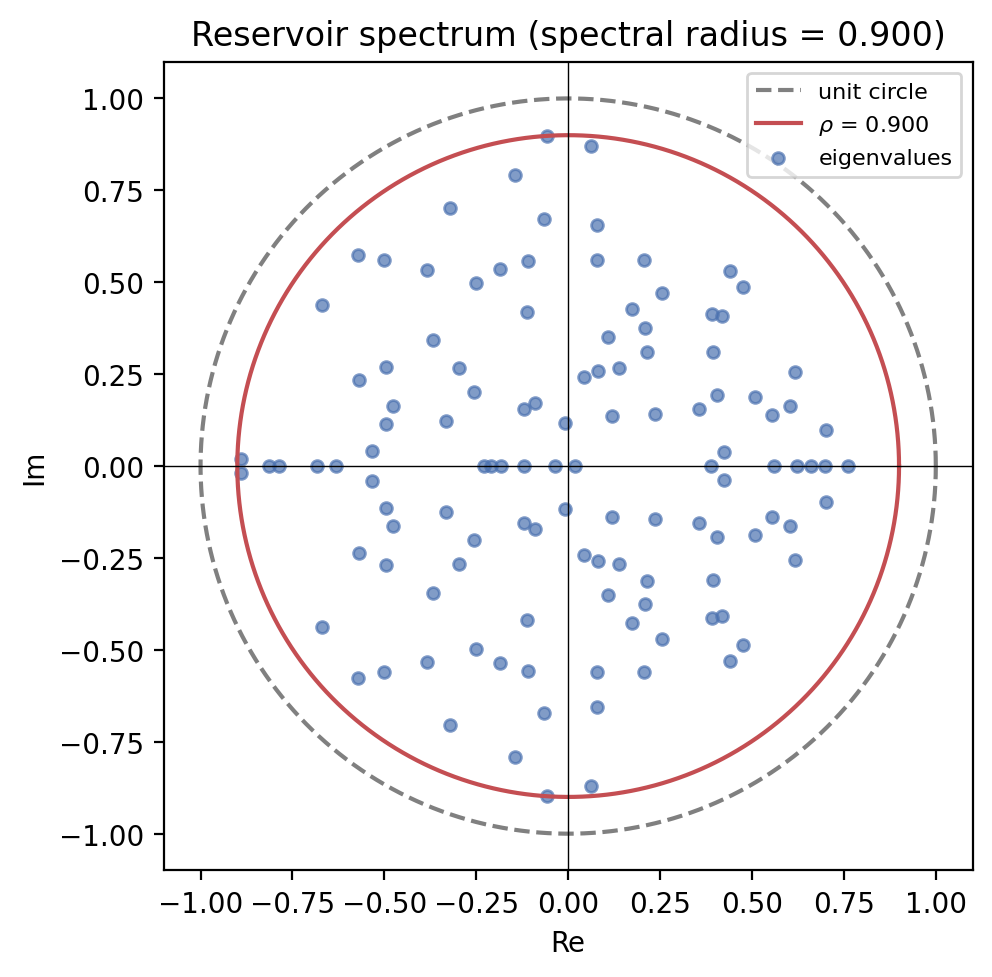
viz.plot_spectrum(esn).show() # eigenvalues + unit circle + ρ
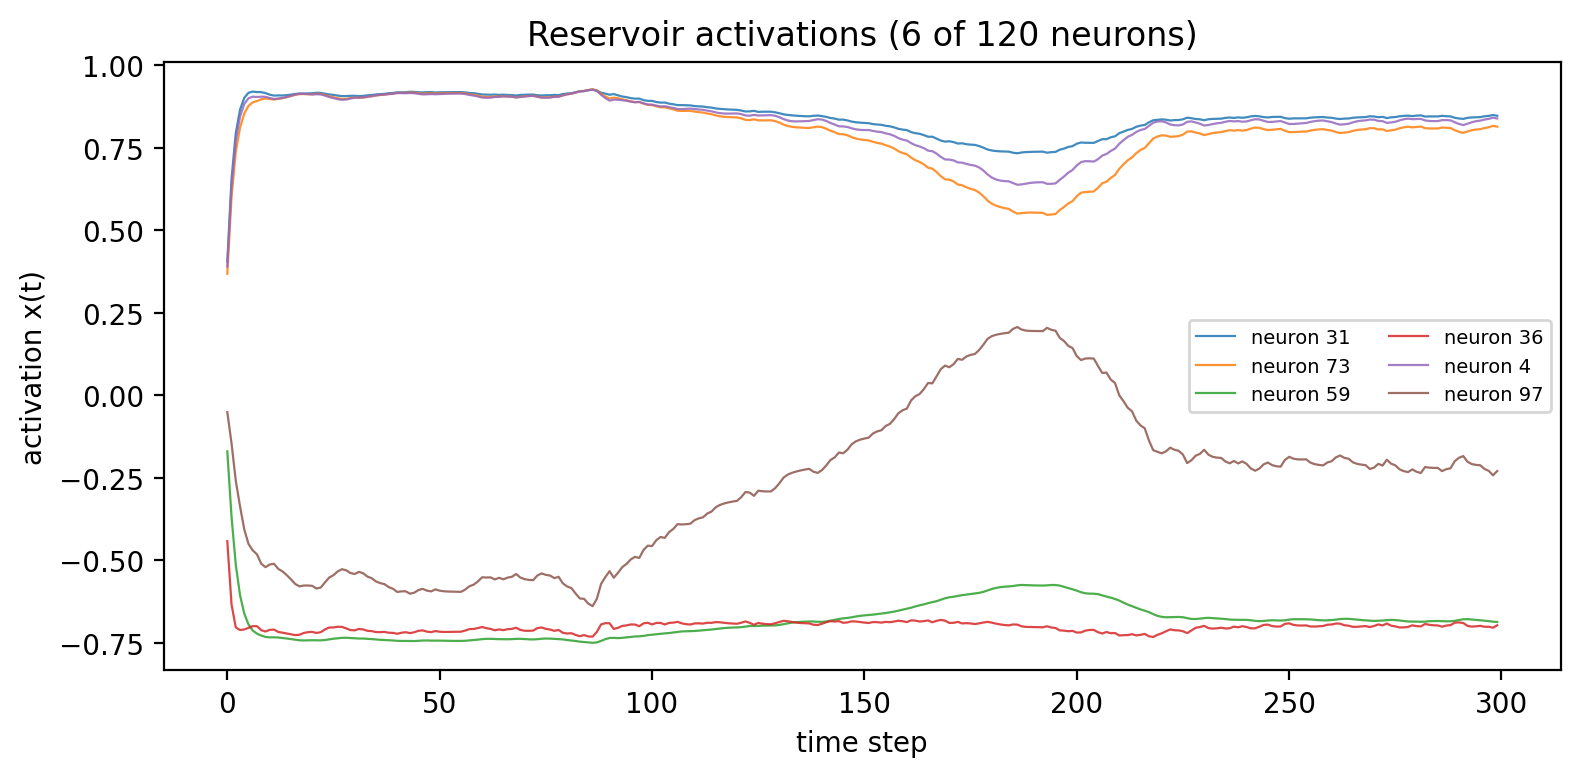
viz.plot_states(esn, u_te).show() # reservoir activations over time
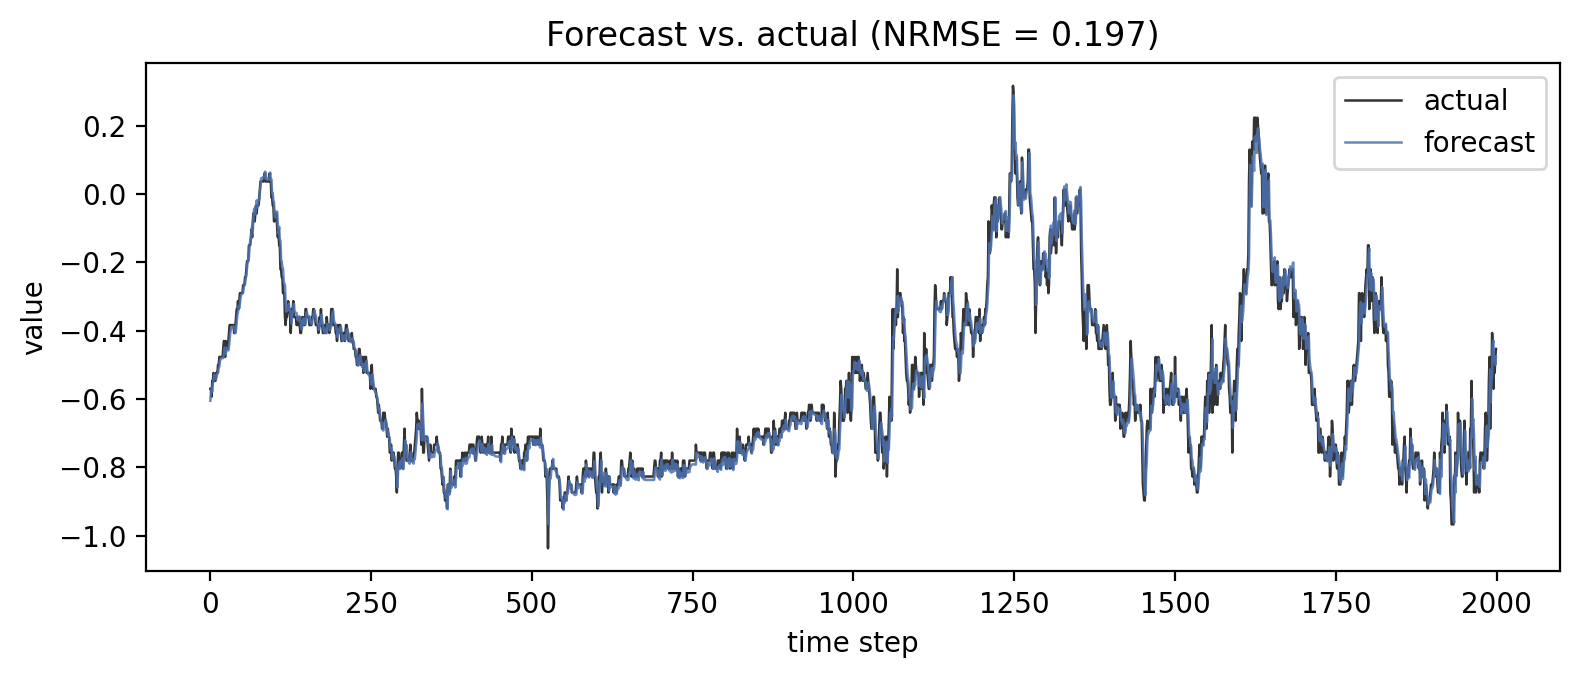
viz.plot_forecast(y_te, esn.predict(u_te), washout=100).show()
viz.save(viz.plot_spectrum(esn), "spectrum.html") # or .png (needs kaleido)
| Function | Shows |
|---|---|
plot_reservoir | reservoir connectivity as a network graph |
plot_spectrum | eigenvalues in the complex plane (echo state property) |
plot_states | a sample of reservoir activations over time |
plot_forecast | predicted vs. actual with NRMSE |
The default Plotly backend produces fully interactive figures — see them live on the Examples page. See the API reference.