Examples
Interactive plots
These are produced by esnfed.viz with its default Plotly backend — pan, zoom and hover. (Generated by examples/plotly_gallery.py.)
Animations
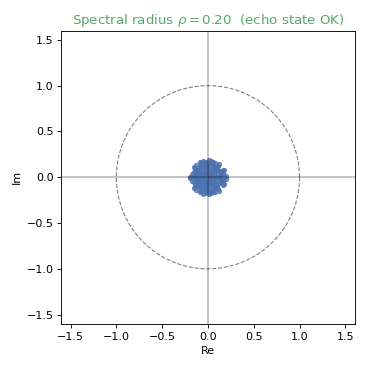
The spectral radius controls the echo state property — eigenvalues must stay inside the unit circle:
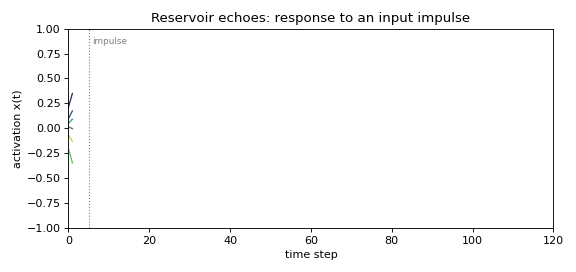
A reservoir's fading response to an input impulse — the "echoes":
Worked example scripts
In the examples/ folder:
tutorial_finance.ipynb— an end-to-end federated counterparty-risk walkthrough (also rendered as the Tutorial page).plotly_gallery.py— regenerates the interactive plots above.flower_federated_ridge.py— the Flower integration.make_animations.py— regenerates the GIFs above.privacy_demo.py— differential privacy + secure aggregation of the federated statistics.streaming_demo.py— incremental / streaming ridge and the RLS online readout.classification_demo.py— federated sequence classification (self-contained toy).
Recipes — the newer capabilities
See the Privacy & streaming and Sequence classification guides for the full story.
from esnfed.streaming import StreamingRidge

acc = StreamingRidge(ref.readout_dim, ref.n_outputs, ridge=1e-6)
for Z_chunk, Y_chunk in stream:        # accumulate as new data arrives
    acc.update(Z_chunk, Y_chunk)
W = acc.readout()                      # exact ridge over everything seen
acc.merge(other_client_acc)            # merging == the federated sum